“Building good habits is the key to success.” — storytelling WITH data
Monthly Challenge (challenges from storytelling WITH data community)
SEP 2021 | Envision Education
The challenge for September 2021 was to find some data on education, analyze it, and create a visual. As a woman who completed both Bachelor's and Master's in STEM fields and as a big fan of The Big Bang Theory, I created a vertical bar chart to show the gender gap in STEM fields, especially in "Computer Sciences" and "Engineering and Technology" program.
AUG 2021 | Dashboard Stories
The challenge for August 2021 was to use an exploratory dashboard as source material and create a visualization based on that data that tells a specific story. I used the viz from the Viz of the Day on Tableau Public Gallery, and built a horizontal bar chart to show how the original author Wendy spends the time saved by working from home.
JUL 2021 | Exploring unit charts
The challenge for July 2021 was to create a unit chart. I made over a funnel chart, turning it into a 10x10 area graph using icons. With my unit chart, audiences can engage and feel the sense of numbers more, and they are able to compare parts of the whole at different stages and the stages to each other in size. Additionally, I used a key takeaway as a title to further give a call to action.
JUN 2021 | Reading into Red
The challenge for June 2021 was to create a visualization that uses red as its primary color. I built a line graph and used red for emphasis as red is the main color of the Red Sox. The key takeaway of my chart is that throughout MLB stadiums, Red Sox have the most expensive beer, both in 2013 and 2018.
MAY 2021 | How we've grown
The challenge for May 2021 was to take stock of our own growth and do some spring cleaning on our past data visualizations. I made over some visuals that I created in 2019. In order to show the preliminary survey results of my research paper, I changed from tables to a connected dot plot to effectively communicate data findings.
APR 2021 | Ask & Answer
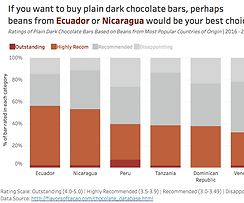
The challenge for April 2021 was to pose a question that data can be used to help understand. I first proposed my question "Where are the best cocoa beans grown?", and then made three clarifications according to "How to ask good questions?" Finally, I answered my question using a 100% stacked bar chart with a takeaway title.
MAR 2021 | March MAPness
The challenge for March 2021 was to make a map. Normally, I use a gradient color palette to fill out the maps, showing numerical data. Yet, to be more creative, I created a hex-tile map with icons to represent categorical data. I am happy to share that Mark Palmer, a SVP & General Manager of Products and Engineering at TIBCO, has written a detailed analysis of my interactive map dashboard!

FEB 2021 | Draw your Data
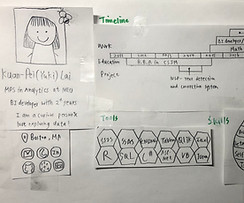
The challenge for February 2021 was to sketch a graph. I shared the sketch of my infographic resume (Jan challenge.) Since I drew it with pencil and paper, I wasn't restricted by a prototype and was able to draw small pieces separately and finally put them into a single paper. Also, I considered lots of alternatives before I ever touched a tool.
JAN 2021 | Visualize your Resume
The challenge for January 2021 was to create and share a visual resume that tells a story about our professional experience. After briefly answering some questions such as "Who is your audience?" and "How is your resume going to be shared?", I built my interactive visual resume and finally checked visualizing my resume off my to-do-list.
DEC 2020 | Critique then (re)create
The challenge for December 2020 was to compose a thoughtful critique and recreate a more effective visual for the given graph. After evaluation, I kept the advantages of the original visual, but changed the graph type, improved the confusing elements, and gave a new clear takeaway.
NOV 2020 | Explain the Change
The challenge for November 2020 was to create a chart that allows the viewer to see the components of the change and not just the summary numbers. I used a bump chart to show the change in suicide distribution across different age groups over time. Furthermore, audiences can hover over to see more details in Tooltip.
OCT 2020 | Face your Fear: xenographphobia
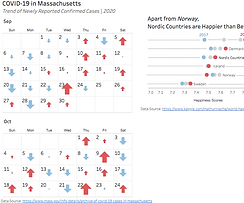
The challenge for October 2020 was to identify a chart that brings us pause. That is, xenographphobia is the fear of an unfamiliar graph. I shared a chart that combined calendar and trend arrows. This type of graph is useful when analyzing trends against specific days like Labor Day, which we may not notice in a standard line chart.
SEP 2020 | Build a Table
The challenge for September 2020 was to create a table. Based on my past experience as a business intelligence developer at a university, I displayed and explained when and why tables were beneficial for me in assisting over 50 departments and non-technical offices across the school in analyzing KPIs.
AUG 2020 | Make a Perfect Pie
The challenge for August 2020 was to create a pie chart. Most of the time, pie charts are not that effective or easy for audiences to digest. Yet, I suggested that there still exist some circumstances in which a pie chart could perform well. Thus, I made and shared some pies and donuts that I found effective.
“Data are just summaries of thousands of stories –
tell a few of those stories to help make the data meaningful.” — Dan Heath
Storytelling Project

Bike-Sharing System Maintenance Days
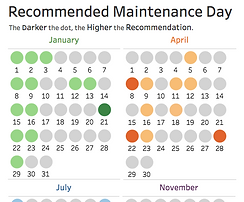
I followed guides from two storytelling WITH Data books. Bike-sharing services are convenient for people. However, just like a car, bicycles also wear out after a period of use and must be maintained to provide continuous service. Thus, the project aims to tell stories using historical bike usage data, and ends with data-driven recommendation of maintenance days for the D.C Bike-Sharing System.
Risk Management regarding Public Health
This is an extra credit project from Risk Management Analytics course.
I used public health data downloaded from the CDC, built graphs using Tableau, investigated the death rates for different causes of death by gender, and examined the prevalence of heart disease and cancer by gender and age. Additionally, after identifying 5 health risks, I proposed some risk management plans to mitigate them.
“You practice and you get better. It's very simple.” — Philip Glass
Practice
The Big Bang Theory Dashboard
Previously, I performed text mining of The Big Bang Theory episode plot descriptions. Then, I built a TBBT dashboard with a word cloud. In the dashboard, I also used a heat map to show IMDB rating by season and episode, and a waterfall chart to plot viewers over time by first and last episode in each season.
Provide Feedback with others
Sharing feedback with others is also critical for refining and perfecting data communications. Thus, I responded to a feedback request from the storytelling WITH data community, and provided the requester three different kinds of graphs to consider for delivering his main points.
Declutter Exercise
A clutter in data visualization can make visuals appear overly complicated and increase the work audiences have to undertake in order to understand what they are viewing. Thus, to let our data stand out more, we have to declutter. To practice, I took an exercise from the storytelling WITH data community.


